Flat Base
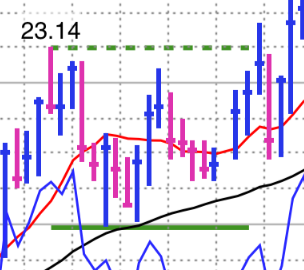
A stock chart pattern studied by MarketSmith founder William J. O’Neil, a Flat Base moves straight sideways in a relatively narrow price range. Flat bases often occur after a stock runs up after breaking out of one of the other chart patterns.
Flat bases form over a 5 to 65 week range. The minimum depth is 0% with a maximum of 15%.